3 %
The Kuala Lumpur Composite Index (KLCI) has rallied.
Roughly 90 % of that lift comes from the ten listed banks, whose individual performances range from a modest –1.83 % (AmBank) to a robust 12.77 % (Affin Bank).
Why the banks matter: Their strong earnings and capital positions give them the flexibility to return cash to shareholders, either through dividends or share‑buybacks. The two charts that follow illustrate exactly how solid those fundamentals are.
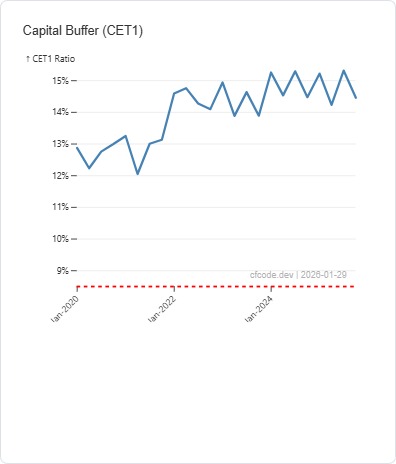
Chart 1 – CET1 Ratio for CIMB (2020‑Present)
What the chart shows: The Common Equity Tier 1 (CET1) ratios for CIMB since 2020.
Key takeaway:
CET1 ratios for CIMB have consistently ranged between 11 % and 15 % over the past several years. This indicates a healthy capital buffer and the ability to fund shareholder returns without jeopardising prudential standards.
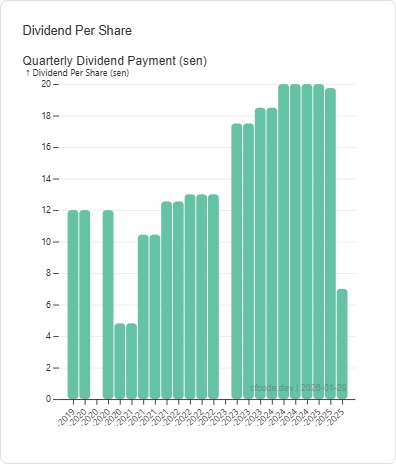
Chart 2 – CIMB Dividend Payments (2020‑Present)
What the chart shows: Annual dividend per share (or total dividend payout) for CIMB from FY 2020 through the latest quarter.
Key takeaway: The dividend line has been steady‑growing, reflecting CIMB’s consistent profitability and its commitment to returning capital to shareholders. The most recent announcement confirms a continuation of this policy.