How are the Malaysian banks performing?
The price actions of the Malaysian Banking Sector tells us a thing or two about how the banks were doing since the Covid years.
Here is a CET1 Capital Ratio chart for all the banks in Malaysia.
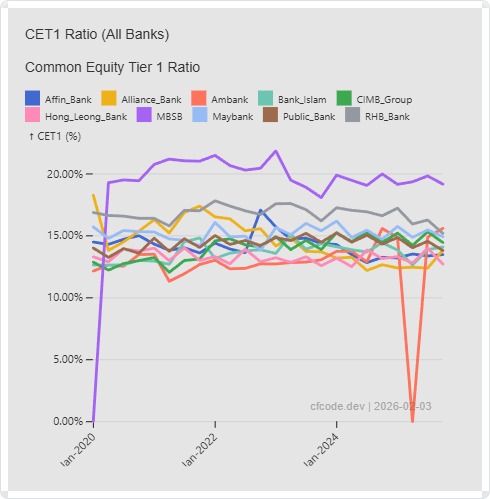
The live charts is available here
All the values are above the minimum regulatory requirement of 8.0%, indicating that the banks are well-capitalized. The banks can then improve their capital management plan, and reward shareholders with higher dividends or share buybacks, provided they received the necessary approvals from Bank Negara Malaysia.
Most banks have been maintaining a generous dividend payment since the Covid years.
Here is what Maybank has been paying out as dividends since 2019:
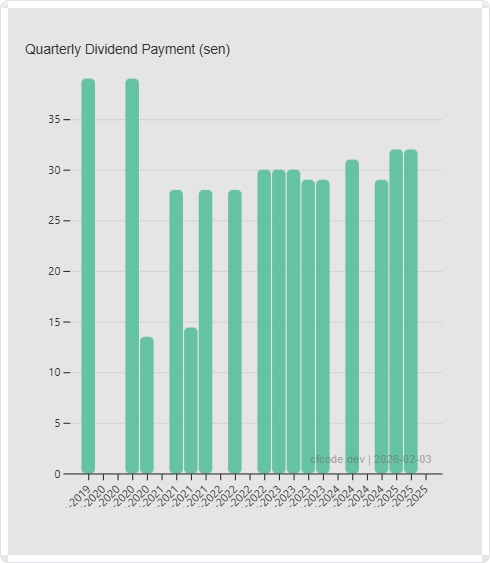
Live chart is here
If you look at the amount of price actions YTD though, some banks are definitely better run than others.
Here is the breakdown of their performances year to date (YTD) as of February 2026:
Maybank - 11.26%
CIMB - 3.03%
Public Bank - 7.05%
RHB - 5.06%
Hong Leong Bank - 9.12%
AmBank - -1.83%
Affin Bank - 12.77%
Alliance Bank - 2.57%
MBSB - 3.55%
BANK ISLAM Malaysia - 6.99%
CIMB’s Net Income trajectory is clearly been increasing since the Covid years.
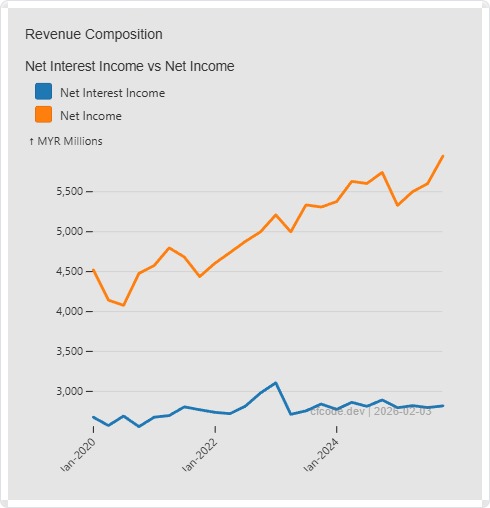
Live chart is here
Other banks with similar trajectory are Public Bank, RHB Bank, Alliance Bank, Hong Leong Bank and to a similar extent, AmBank.
As for the laggards, some of them have issues to resolve even if their fundamentals are decent.
For example, Affin’s bank’s Cot-to-Income ratio is on the high side.
Live chart is here
MBSB Bank has been struggling with its Gross Impaired Loans ratio which is still elevated compared to its peers.
Live chart is here
You can take a look at the rest of the banks’ financial health via the dashboard here.